Building suitable cohorts
Substantiating our approach towards discovering disease-relevant biomarkers effectively to predict patients’ diagnostic status necessitated creating a comprehensive dataset to represent our patient cohort. The cohort consisted of 61 CVD patients, including 40 males and 21 females, aged 45–92. The participants self-identified their race as follows: 42 were white, 7 were black or African American, 1 was Asian, and 11 were of unknown race. These individuals were clinically diagnosed with CVDs, specifically Heart Failure (HF), and Atrial Fibrillation (AF). In addition, we constructed a control group comprising 10 healthy individuals, evenly split between males and females. Among them, 9 identified as white, and 1 did not disclose their race. The age range of this group was 28–78 years. A persistent challenge in multi-genomic data analysis lies in the integration and standardization of large volumes of sequence data2. Currently, processed gene expression and variant data available through genomic pipelines are not available in AI/ML ready formats2. With its availability as AI/ML input, it can be used directly for predictive analysis2,34,35. To address this challenge, we propose the Clinically Integrated Genomics and Transcriptomics (CIGT) format, which integrates heterogeneous clinical, demographic, genomic and transcriptomic patient data. Due to the limited clinical history of our cohort, we focused on patient information such as age, gender, racial, and ethnic background, and gene expression data derived from RNA-seq. These attributes have shown their effectiveness in the development of genotype–phenotype studies34. In the future, attributes in the CIGT dataset could be expanded to integrate variant data as well as include more clinical attributes including but not limited to medications and risk factors such as smoking and alcohol consumption.
All procedures involving human participants were in accordance with the ethical standards of the institution and with the 1964 Helsinki Declaration and its later amendments or comparable ethical standards. All human samples were used in accordance with relevant guidelines and regulations, and all experimental protocols were approved by the Institutional Review Board (IRB) of Rutgers. Utilizing our proposed CIGT format, we integrated transcriptomics, clinical, and demographics data of each patient (Supplementary Material 1). Data pre-processing increased our cohort’s strength through the elimination of non-ubiquitous patient attributes; features present in 80% of the cohort were included and the less occurring were eliminated from the CIGT dataset to avoid extrapolation from ML classifiers downstream. Resulting from this filtration, 751 transcriptomic and clinical biomarkers remained suitable. The CIGT dataset was subset into training and testing sets, with a testing size of 30%.
Discovering supported biomarkers
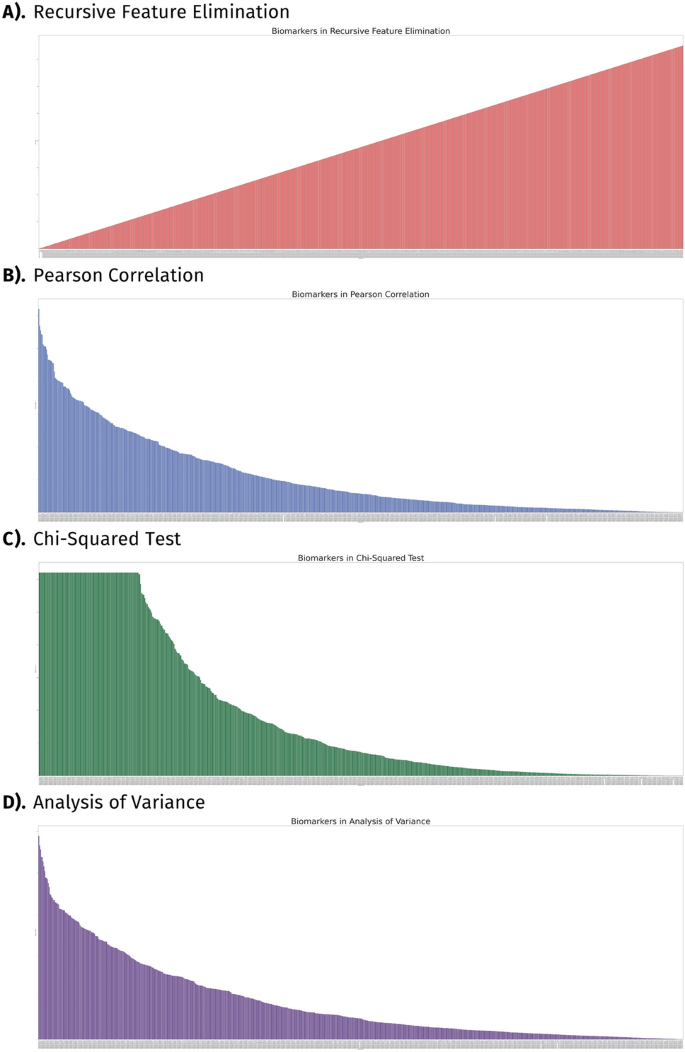
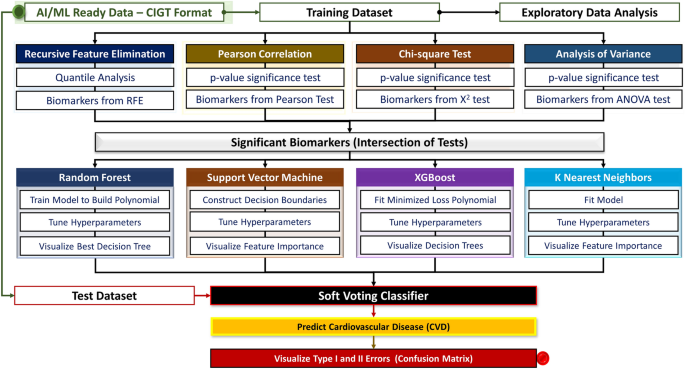
Statistical algorithms were applied on the training dataset to retrieve highly significant biomarkers. To assess the differences in expression levels and clinical characteristics across CVD patients and healthy individuals, we employed a convergence of four statistical algorithms: (I) Recursive Feature Elimination (RFE), (II) Pearson Correlation, (III) Chi-Square, and IV) Analysis of Variance (ANOVA) (Fig. 2). To ascertain the statistical significance of each algorithm, we conducted a p value significance test and recorded the obtained p values in a list together with the raw scores generated by each algorithm (Supplementary Material 2). We exercised the scientific standard of 0.05 as a threshold for our statistical significance test and utilized the logarithmic function, with a base of 10, for easier interpretation.

Feature selection of biomarkers. This figure presents the statistical significance test to determine the importance of each gene according to the algorithm used. The y-axis represents the p values as a logarithmic expression while the x-axis displays distinct biomarkers. Features are displayed from (A) Recursive Feature Elimination; (B) Pearson Correlation; (C) Chi-Squared test; and (D) Analysis of Variance.
RFE systematically eliminated the least informative features, which enabled the identification of the strongest correlations between biomarkers and CVD. The RFE algorithm assigned scores to each feature, reflecting their relative importance, with higher scores indicating lesser significance. These scores were then utilized to rank the features based on their relevance to CVD diagnosis (Fig. 2A). Next, the Pearson correlation test was applied to quantitively assess the magnitude of linear association between biomarkers and CVD. In our study, we observed the correlation coefficient, which ranges from − 1 to 1, with larger absolute values indicating a more pronounced association. However, to assess the statistical significance of the findings, we also examined the negative logarithm of the p value for both transcriptomic and clinical features (Fig. 2B). Notably, higher bars in the graph indicate greater significance to CVD diagnosis.
We applied the chi-square test to investigate the independence among categorical factors on CVD detection and discern any significant relationships that may exist (Fig. 2C). We calculated the chi-square statistic to quantify this independence (Supplementary Material 2). We utilized the ANOVA test to discern the difference in the distribution of gene expression patterns between healthy individuals and those afflicted with CVD (Fig. 2D). We computed the F-statistic to measure this variability (Supplementary Material 2). We found 313 biomarkers to be supported across three of our algorithms (Pearson correlation, chi-square test, and ANOVA). The presence of high outliers, such as genes HBA1 and HBA2, which are beneficial in traditional selection methods but detrimental to predictive model training, diminishes importance within our RFE classifications. To counterbalance precursory approaches to subset our biomarkers, we implemented RFE. Biomarkers classified within the top 10% were endorsed for further predictive analysis (Table 1).
Predicting cardiovascular disease
Transcriptomic attributes serve as our predictive engine’s training dataset. This engine consists of five unique classifiers to forecast case/control predictions for our testing dataset: Random Forest (RF), Support Vector Machine (SVM), Xtreme Gradient Boost (XGBoost), k-Nearest Neighbor (k-NN), and Soft Voting Classifier (SVC). Metrics, including weighted-average F1 scores and receiver operating characteristic curves (ROC), were calculated for each classifier. Weighted-average F1 scores evaluate models in circumstances where categorical predictors are not balanced. ROC-AUC provides an additional approach to ML performance evaluation, showing a probability of a binary classifier to make true predictions rather than false positives. Values approaching 1.0 in each measure suggest high performance. Exact metrics such as accuracy, ROC-AUC and weighted average F1 scores for each algorithm are provided in Supplementary Material 3.
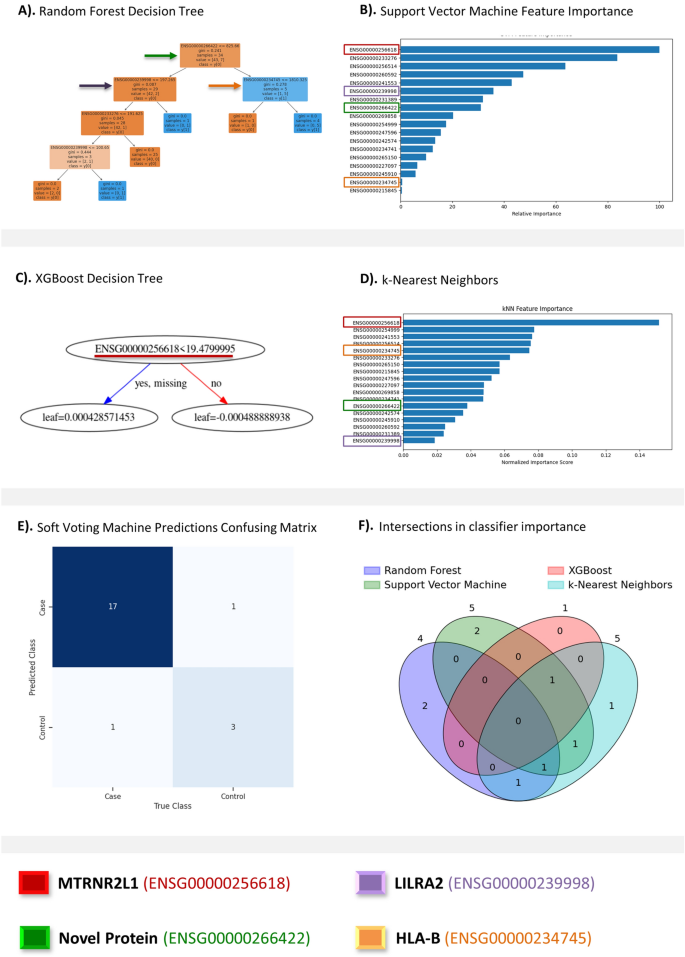
RF has demonstrated practical usage within transcriptomics23. Optimizing RF with GridSearchCV (Fig. 3A), using dataset-standard parameters, the decision tree classifier made the most accurate predictions. RF selected case/control correctly in 95% of testing patients. Important features involved in RF prediction include RN7SL593P, LILRA2, and HLA-B (Fig. 3A). ROC-AUC for our RF classifier was 0.95. The weighted-average F1 score was 0.96. SVM, a classifier suited for single-diagnosis case/control predictions, performed satisfactorily. Optimized using GridSearchCV using dataset-standard parameters (Fig. 3B), the SVM classifier succeeded with 91% of predictions. MTRNR2L1, GPX1, and AP003419.11 are the SVM classifier’s most essential features. This model’s ROC-AUC was the highest, 0.99. The SVM classifier’s weighted-average F1 score was 0.91. XGBoost, another decision tree-based approach, provides an accessible approach to classification. The performance of XGBoost rivals our SVM classifier, scoring 91% on predictions. XGBoost was optimized with GridSearchCV using dataset-standard parameters (Fig. 3C). XGBoost’s best tree functioned using MTRNR2L1 as its sole feature. XGBoost’s ROC-AUC was 0.94. The XGBoost classifier’s weighted-average F1 score is 0.91. k-NN’s performance was feeble compared to RF, SVM, and XGBoost. Tuned with GridSearchCV using dataset-standard parameters (Fig. 3D), the k-NN classifier hit 91% of predictions. This pairs with 0.85 ROC-AUC and 0.91 weighted-average F1 score. k-NN is a resource-intensive algorithm, producing worse performance at extended runtimes compared to our previous classifiers. k-NN used MTRNR2L1, BRK1, and ARPC4 most when forming predictions.

Results of predictive analysis. This figure presents results of AI/ML based predictive analysis and that include, (A) Random Forest decision tree; (B) Support vector machine feature importance; (C) XGBoost decision tree; (D) k-Nearest neighbors; (E) soft voting classifier predictions confusing matrix; and (F) Venn diagram detailing the counts of overlapping between the top five biomarkers from each classifier.
RF and XGBoost classifiers proved most applicable to transcriptomic datasets. SVM performance is sufficient for case/control classifications, but diverse problems engaging multiple diseases and disorders will lead to substantial performance declines5. k-NN is the least appropriate for such datasets. MTRNR2L1 was the best transcriptomic marker for CVD predictions, with top-three importance for our SVM, XGBoost, and k-NN classifiers. We employed hyperparameter tuning to each algorithm and combined them through a Soft Voting Classifier to create a robust predictive engine capable of accurately classifying data based on user-defined criteria. Our ensemble model was able to accurately classify seventeen individuals as CVD patients and three individuals as healthy. It also had two incorrect classifications where one was a false positive and the other a false negative (Fig. 3E). Identifying the intersectionality between the four classifiers’ (RF, SVM, XGBoost and k-NN) most important biomarkers, we generated a non-traditional Venn diagram (Fig. 3F). The five most significant biomarkers were extracted from each classifier. Methods that relied on less than five biomarkers (RF, 4; XGBoost, 1) had only those included. This visualization illustrates which classifiers relied on similar biomarkers to others to make their predictions.
Examining transcriptomic predictors
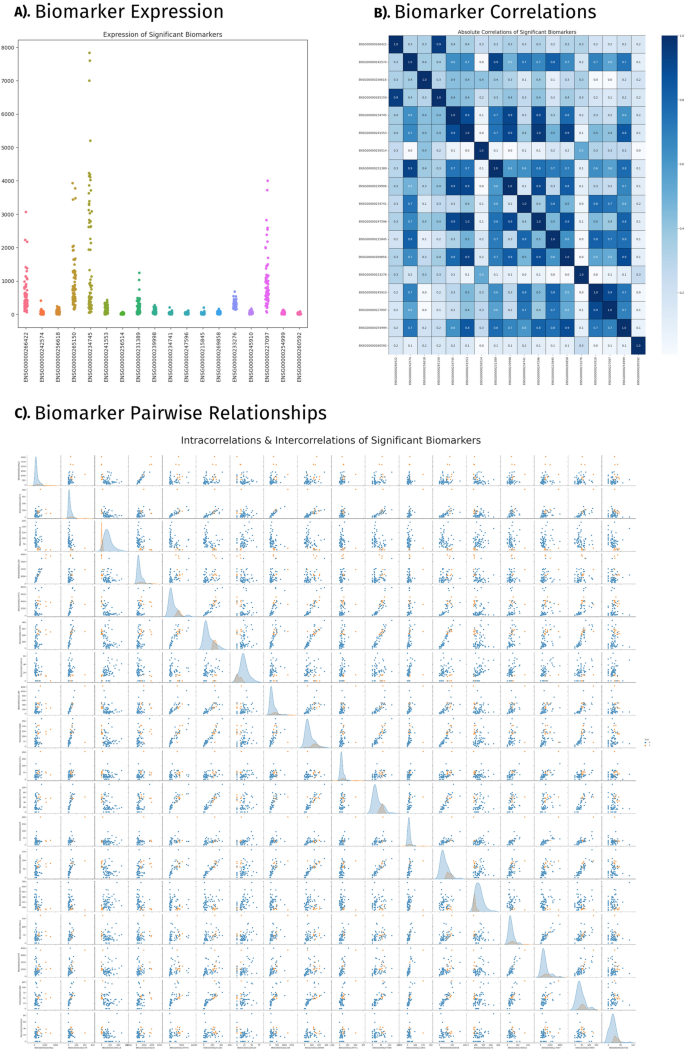
Validating the detected biomarkers’ relevance to our cohort’s diagnoses necessitated an in-depth inspection of their function in prediction and prominence in previous literature. Alongside a thorough review of previous scientific findings, biomarkers correlations are reported and tied to their roles in disease classification. The literature review revealed 14 transcriptomic biomarkers linked with CVDs and a variety of other diseases and disorders within our cohort. HLA-DMB and HLA-B are associated with cardiomyopathy. RN7SL2 and GPX1 are associated with stroke. ARPC4 and LILRA2 are associated with atherosclerosis. Transcriptomic markers (Fig. 4A) found within the supported list are also associated with various types of chronic diseases) and disorders (cancers, rheumatoid arthritis, and diabetes. Visualizations displaying clustered profiles of transcriptomic expression (Fig. 4B) and their associations with biomarker’s intercorrelation (Fig. 4C) indicate the mechanisms of disease classification. This correlation metric was supported using literature as well. Genes TWF2 and ARPC4 scored perfect correlations.

Significant biomarkers. This figure presents results of the statistical analysis and that include, (A) Biomarker expression; (B) Biomarker correlations; and (C) Biomarker pairwise relationships.
Pseudogene MTRNR2L1 was the observed feature in all three classifiers: SVM, XGBoost, and k-NN. MTRNR2L1 presented fluctuating expression across patients and failed to surpass a correlation above 0.5 with other transcriptomic biomarkers. GPX1, AP003419.11, and CTA-363E6.6 were the three most important features of the SVM classifier beside the previously mentioned MTRNR2L1. MTRNR2L1 and GPX1 have been linked to CVDs, while AP003419.11 and CTA-363E6.6 have not been previously reported. These three transcriptomic markers are the least correlated with each other, the most independent function biomarkers within our list. The SVM classifier, more than others, is reliant upon independent-acting transcriptomic factors whose expression is not tied to that of another biomarker within the selected list. A cluster of highly correlated biomarkers identified, RPS28P7, SNHG6, and TSTD1, did not perform well with SVM classifier. The k-NN classifier did not display similar patterns regarding the correlation of transcriptomic biomarkers.
The XGboost classifier was reliant solely on MTRNR2L1, indicating the strongest association to CVDs of any transcriptomic biomarker. This algorithm ties the under expression of the lncRNA with CVD status. The RF classifier relied most prominently on the RN7SL593P biomarker, classifying patients below the threshold of 825.66 TPM as CVD cases. The overexpression of RN7SL593P has been linked to normal platelet function, a non-direct implication with CVDs. The RF classifier also placed heavy importance on LILRA2, HLA-B, and GPX1 with direct links to CVDs. The decision tree algorithms contained only elements previously associated with CVDs within their optimized tree using our hyperparameter tuning metrics.
MTRNR2L1, RN7SL593P, LILRA2, and HLA-B showed the most distinct variety in their importance throughout the different classifiers. MTRNR2L1, scored the most important across three classifiers, but was not found in RF’s decision tree. LILRA2 and HLA-B scored a correlation of 0.9, near perfect. HLA-B ranked as the fifth most important feature in our k-NN classifier and the second least important in the SVM classifier. LILRA2 placed as the sixth most important feature in our SVM classifier and last in our k-NN classifier. RN7SL593P, the workhorse of random forest, served average throughout the remaining classifiers. These incongruencies are algorithmically dependent but may offer some understanding of underlying biological interactions between these biomarkers and CVD.


